The Unexpected AI Stack: C# + .NET (Part 5)
Summary
- Doing logging and telemetry well are a key piece of the puzzle to helping agents work more autonomously and more efficiently in a codebase
- Configuring logging and telemetry to produce contextual metadata and providing the agents a mechanism to search for these messages via Aspire gives agents the tools to pin-point issues and understand the runtime flow of the application
- Combined with CSharpRepl, agents can quickly iterate on the running codebase, produce experiments, and then incorporate ephemeral experimental code into the application without needing to recompile or restart the application
- This final piece of the foundational codebase will allow teams to embrace agentic engineering and have confidence that the agent is producing solid code at each pass (the human operator still has to guide the agents directionally as we’ll see!).
- Part 1 will introduce two under-the-radar components of the .NET stack that make it surprisingly amenable to building software with agents: Aspire and
CSharpRepl. - Part 2 will dive into a hands-on implementation from the ground up to scaffold an open-source template for teams to build on top of.
- Part 3 will implement the next layer of the application including a simple streaming interface to the Copilot SDK agent.
- Part 4 will extend the application with Testcontainers to demonstrate how to simplify test execution for agents with stateless containers.
- Part 5 (👈 you are here) will configure the application with logging, telemetry, and observability before diving into building the actual application using your coding agent.
The full repo: https://github.com/zeeq-ai/zeeq-tmpl/tree/feat-part5-Part-5-code-changes (note the branch; see the PR for the diff)
What we’re building
In this final part of the series, we’ll add in the final pieces of the scaffolding that will help agents work autonomously in this codebase: logging and telemetry. When done right, these will give the agents direct line of sight to the source origins at runtime when building new features and trying to diagnose issues. As we’ll see, Aspire’s built in facilities for Open Telemetry and structured logging give agents visibility into the runtime state of the application.
The last leg of the application is to build a specification writing surface that allows the agent to give continuous feedback on the specification as it runs research on the underlying code as the specification is being written.
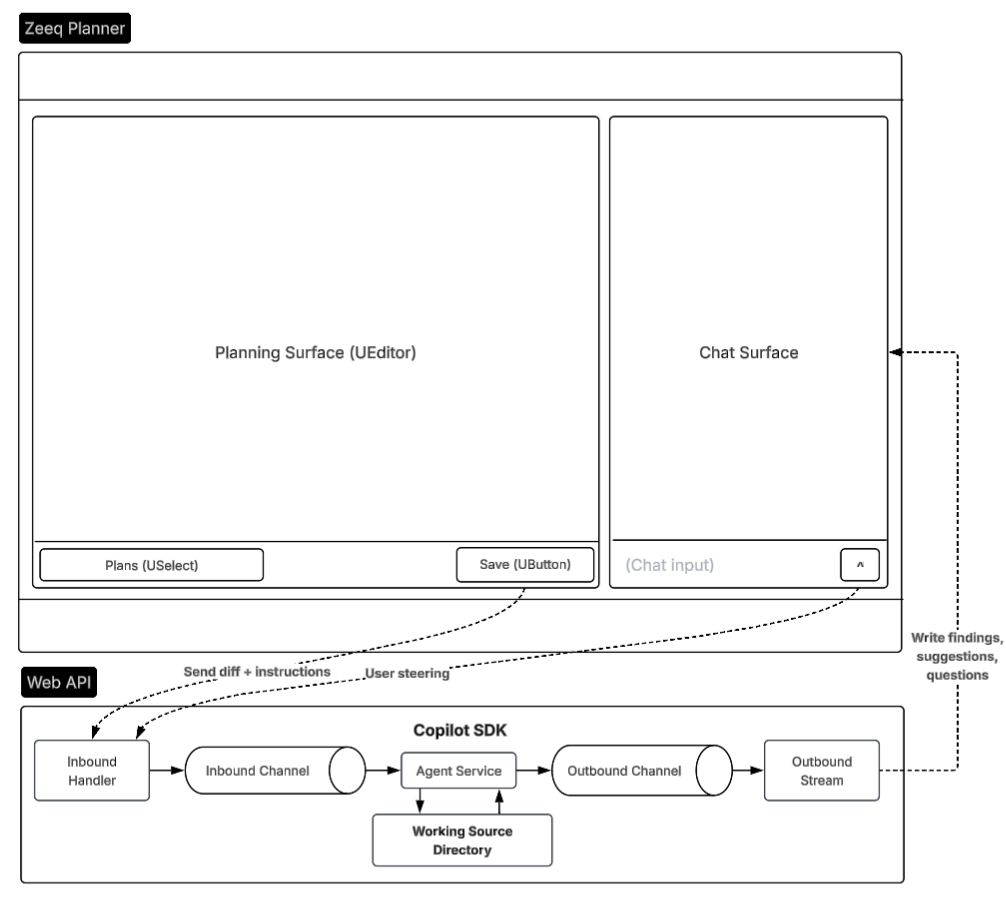 A planning surface for writing specifications that the agent will automatically process and start building a plan from.
Scaffolding logging, telemetry, and observability
A key foundation of building software systems agentically is to provide agents a well-designed logging and telemetry setup that allows agents to pin-point issues and understand the runtime state by examining logs and telemetry spans.
To this effect, we’ll wire up Serilog for logging and OpenTelemetry to emit spans that the agent can search for in Aspire using the CLI.
Adding the logging and telemetry packages
cd src/server
# Serilog packages for logging
dotnet add package Serilog
dotnet add package Serilog.AspNetCore
dotnet add package Serilog.Sinks.Console
dotnet add package Serilog.Sinks.OpenTelemetry
# OpenTelemetry packages for telemetry
dotnet add package OpenTelemetry
dotnet add package OpenTelemetry.Exporter.OpenTelemetryProtocol
dotnet add package OpenTelemetry.Extensions.Hosting
dotnet add package OpenTelemetry.Instrumentation.AspNetCore
dotnet add package OpenTelemetry.Instrumentation.Http
dotnet add package OpenTelemetry.Instrumentation.EntityFrameworkCore --prerelease
# Package level support for telemetry
dotnet add package Npgsql.OpenTelemetry
Wiring the runtime for logging
The logger will be set up to ship to the console and to OpenTelemetry. The agent can see the logs by directly querying for console logs or seeing them in the context of an OpenTelemetry span.
// src/server/Program.cs
// Setup logging
var attributes = new Dictionary<string, object> { ["service"] = "zeeq" };

Log.Logger = new LoggerConfiguration()
    .WriteTo.Console(
        // Note the "Here" token placeholder that will include the call site 👇
        outputTemplate: "[{Timestamp:HH:mm:ss.fff} {Level:u3}] {Message:lj} ({Here}){NewLine}{Exception}"
    )
    .WriteTo.OpenTelemetry(options =>
    {
        options.ResourceAttributes = attributes;
    })
    .MinimumLevel.Override("Microsoft", LogEventLevel.Warning)
    .MinimumLevel.Override("Microsoft.Hosting.Lifetime", LogEventLevel.Information)
    .CreateLogger();

builder.Services.AddSerilog();
A key part of exposing more context to the agents when it reads the logs is to actually provide the exact member, source file, and line number for each log message.
We can achieve this using .NET’s CallerMemberNameAttribute, CallerFilePathAttribute, and CallerLineNumberAttribute markers to capture the call site of the log message and add it to the log context.
// src/server/LoggerExtensions.cs
using System.Runtime.CompilerServices;
using ILogger = Serilog.ILogger;

namespace Zeeq.Tmpl;

/// <summary>
/// Extension method to capture the call site with member name, file, and line number.
/// </summary>
public static class LoggerExtensions
{
    public static ILogger Here(
        this ILogger logger,
        // 👇 Note the empty defaults; these are populated at call time
        [CallerMemberName] string memberName = "",
        [CallerFilePath] string sourceFilePath = "",
        [CallerLineNumber] int sourceLineNumber = 0
    )
    {
        var srcFile = Path.GetFileName(sourceFilePath);
        var here = $" {srcFile}:{memberName}@{sourceLineNumber}";

        return logger
            // 👇 This will carry the call site of the log message
            .ForContext("Here", here)
            .ForContext("MemberName", memberName)
            .ForContext("FilePath", sourceFilePath)
            .ForContext("LineNumber", sourceLineNumber);
    }
}
The {Here} token in our template will end up being populated with the precise call site of the log message, allowing agents to surgically find the exact location in the codebase that produced the log message.
Wiring the runtime for OpenTelemetry
Next is to wire up OpenTelemetry into the runtime:
// src/server/Program.cs
builder
    .Services.AddOpenTelemetry()
    .ConfigureResource(res => res.AddService("zeeq").AddAttributes(attributes))
    .WithTracing(builder =>
    {
        builder
            .AddAspNetCoreInstrumentation(config =>
            {
                config.RecordException = true;
            })
            .AddHttpClientInstrumentation()
            .AddEntityFrameworkCoreInstrumentation();
    })
    .WithMetrics(builder =>
        builder
            .AddMeter("*")
            .AddAspNetCoreInstrumentation()
            .AddHttpClientInstrumentation()
            .AddNpgsqlInstrumentation()
    )
    .WithLogging()
    .UseOtlpExporter();
Instrumenting the flow of the application
The OpenTelemetry SDK for .NET provides two ways of implementation instrumentation using either System.Diagnostics or the Tracer Shim API.
For this application, we’ll choose the more idiomatic System.Diagnostics approach with several convenience methods that capture the telemetry call site and makes it easier to attach metadata to the span.
// src/server/ZeeqTelemetry.cs
using System.Diagnostics;
using System.Diagnostics.Metrics;
using System.Runtime.CompilerServices;

namespace Zeeq.Tmpl;

/// <summary>
/// Telemetry entry point with convenience methods.
/// </summary>
public static class ZeeqTelemetry
{
    public const string ActivitySourceName = "zeeq";

    public static readonly ActivitySource Tracer = new(ActivitySourceName);

    public static readonly Meter Metrics = new(ActivitySourceName);

    public static void SetTags(params (string Key, object? Value)[] tags)
    {
        foreach (var (Key, Value) in tags)
        {
            Activity.Current?.SetTag(Key, Value);
        }
    }

    // 👇 Convenience method for adding an event with key-value metadata scope
    public static Activity? AddEvent(
        (string Key, object? Value)[] tags,
        string? eventName = null,
        [CallerMemberName] string name = "",
        [CallerFilePath] string filePath = "",
        [CallerLineNumber] int lineNumber = 0
    )
    {
        var activity = Activity.Current;

        var effectiveName = eventName ?? $"{name}@{Path.GetFileName(filePath)}:{lineNumber}";

        activity?.AddEvent(
            new ActivityEvent(
                effectiveName,
                tags:
                [
                    .. tags.Select(tag => new KeyValuePair<string, object?>(tag.Key, tag.Value)),
                    // 👇 Same as with logs: output call site into the OTEL event
                    new KeyValuePair<string, object?>("code.member", name),
                    new KeyValuePair<string, object?>("code.file_path", filePath),
                    new KeyValuePair<string, object?>("code.line_number", lineNumber),
                ]
            )
        );

        return activity;
    }

    // 👇 Convenience method for starting a new span with key-value metadata scope
    public static Activity? Trace(
        (string Key, object? Value)[] tags,
        string? traceName = null,
        [CallerMemberName] string memberName = "",
        [CallerFilePath] string filePath = "",
        [CallerLineNumber] int lineNumber = 0
    ) =>
        ZeeqTelemetry.Tracer.StartActivity(
            $"{traceName ?? $"{Path.GetFileName(filePath)}#{memberName}"}",
            kind: ActivityKind.Internal,
            parentContext: Activity.Current?.Context ?? default,
            tags:
            [
                .. tags.Select(tag => new KeyValuePair<string, object?>(tag.Key, tag.Value)),
                // 👇 Same as with logs: output call site into the OTEL span
                new KeyValuePair<string, object?>("code.member", memberName),
                new KeyValuePair<string, object?>("code.file_path", filePath),
                new KeyValuePair<string, object?>("code.line_number", lineNumber),
            ]
        );
}
Now we can instrument the health endpoint as a test.
// src/server/Endpoints/Health.cs

// Note: updated to `async` to include the DB call as an example
public class HealthHandler(ZeeqContext dbContext) : IEndpointHandler
{
    private static readonly Serilog.ILogger Log = Serilog.Log.ForContext<HealthHandler>();

    public async Task<string> HandleAsync()
    {
        // 👇 Start a trace span here (NOTE: the `using` is required to close the trace)
        using var activity = ZeeqTelemetry.Trace(
            tags: [("endpoint", "health")], // 👈 Arbitrary runtime context metadata
            traceName: "HealthCheck"
        );

        // 👇 This log will be linked to the span
        Log.Here().Information("Health check requested!");

        // 👇 Database access will produce a span with the query!
        await dbContext.Database.ExecuteSqlRawAsync("SELECT 1");

        return $"Healthy @ {DateTime.UtcNow}";
    }
}
At this point, you may still be wondering “why bother with this at all”? To reiterate: the key is to help provide agents visibility into what’s happening as the code is executing so it can autonomously identify and address issues at runtime. To do this well requires that we provide high-signal telemetry that the agents can search and traverse through.
What this looks like in the trace when we curl http://localhost:5138/health:
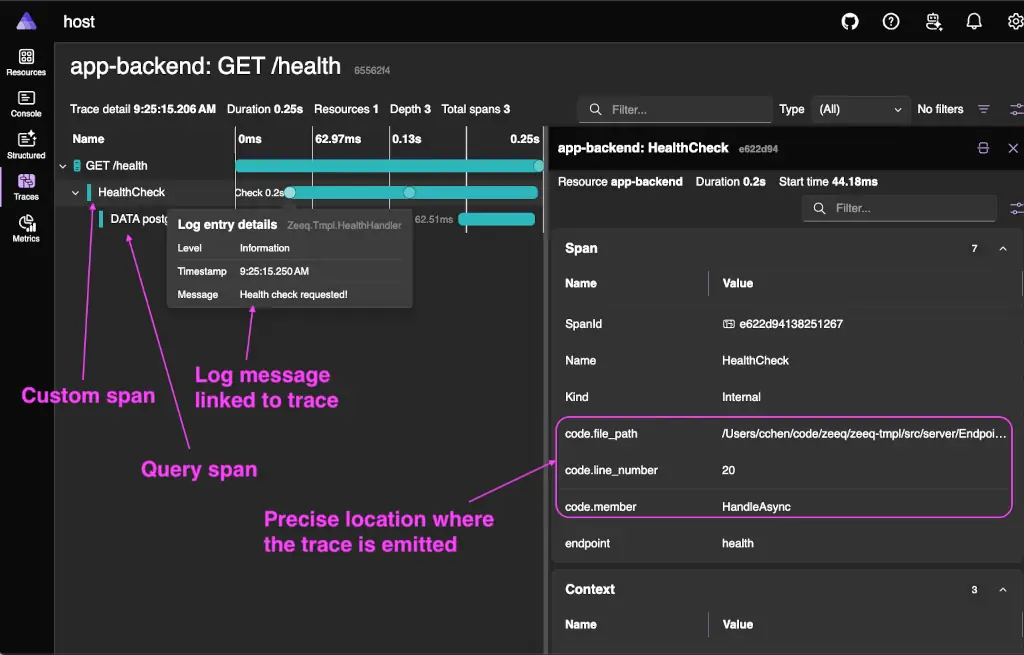 The telemetry trace now has a custom span that carries the information about the exact call site as well as the logs in the scope of the trace.
The human view is useful, but Aspire’s CLI search function provides the tooling that lets agents query and inspect these logs and traces and this is what is important for establishing an agentic foundation for the codebase.
To query for this in Aspire via the CLI:
# OTEL query requires specifying the dashboard
aspire otel spans app-backend --search "Health" --non-interactive --nologo --dashboard-url http://localhost:15050

# The matching spans
09:25:15.206 OK     0.25s app-backend: GET /health ebb3f57
09:25:15.250 OK      0.2s app-backend: HealthCheck e622d94

# In JSON format to expose the metadata
aspire otel spans app-backend --search "Health" --non-interactive --nologo --dashboard-url http://localhost:15050 --format json

# Query by trace
aspire otel traces app-backend --search "Health"  --non-interactive --nologo --dashboard-url http://localhost:15050

# Produces the table of matching traces
┌──────────────┬──────────────────────────────────┬───────┬──────────┬────────┐
│ Timestamp    │ Name                             │ Spans │ Duration │ Status │
├──────────────┼──────────────────────────────────┼───────┼──────────┼────────┤
│ 09:25:15.206 │ app-backend: GET /health 65562f4 │ 3     │ 0.25s    │ OK     │
└──────────────┴──────────────────────────────────┴───────┴──────────┴────────┘
Showing 1 of 1 traces
The structured log also carries this information enriched from using .Here():
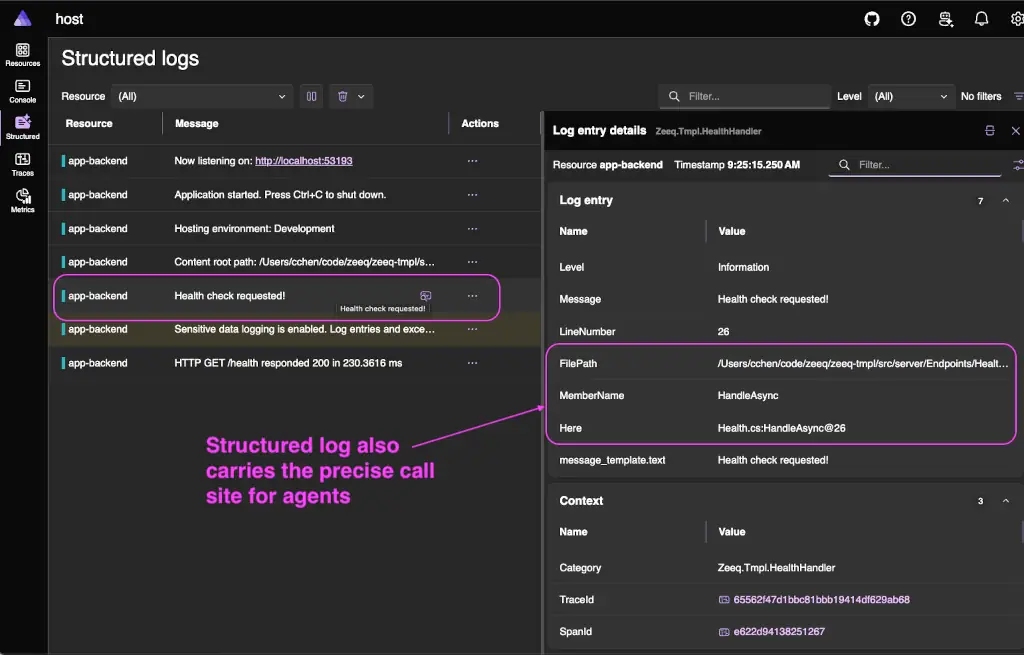 The structured log now has a custom span that carries the information about the exact call site so agents can quickly track down code.
Likewise, we can query for this log:
# Query for our log
aspire logs app-backend --search "Health"

# Produces the following (⭐️ note the source and line number!)
[app-backend] [09:25:15.250 INF] Health check requested! ( Health.cs:HandleAsync@26)
[app-backend] [09:25:15.455 INF] HTTP GET /health responded 200 in 230.3616 ms ()
Now the full power of this stack starts to come into focus: by providing agents deep visibility into the runtime execution of the code plus the ability to manipulate the code at runtime without recompiling or restarting the application, this stack gives agents supreme flexibility to iterate on the codebase autonomously.
Teach the agent how to build a skill
As we did in part 3 and part 4, we’ll teach the agent to manifest a skill to help it use the Aspire stack effectively as it traces the application and generates code.
The agents can figure this out themselves, but will end up wasting turns (and time) each time it has to re-learn this. So we can just capture these learnings one time and teach the agent when and how to use the tools.
As before, I recommend issuing the instructions one part at a time to watch the agent learn and iterate.
<!-- Initialize the doc with a few help commands -->
We are working on writing a skill in .agents/skills/aspire-tracing/SKILL.md using Aspire
Our goal is to keep this skill short, terse, to the point with key examples broken down into sections.
Key commands: `aspire otel spans -h`, `aspire otel traces -h`, `aspire logs -h`, `aspire resource app-backend -h`, `aspire -h`
This document will be organized into sections with notes and examples
Write a quick introductory section and then a table of the key basic commands.
When done, I'll prompt the next experiment

<!-- Teach it how to use the logs -->
Use `aspire logs app-backend --search "Health" --format json` to query for logs in the app-backend service that contain the word "Health".
Note the output format in JSON and how to filter/search through it
Note the log message carries the source location of the log message
Document findings and usage patterns
When done, I'll prompt the next experiment

<!-- Teach it to use the otel commands which require a dashboard URL -->
Use `aspire otel spans app-backend --search "Health" --non-interactive --nologo --dashboard-url http://localhost:15050 --format json` to query for spans
Use `aspire otel traces app-backend --search "Health"  --non-interactive --nologo --dashboard-url http://localhost:15050` to query for traces (try with and without `--format json`)
Note that `--dashboard-url` is required and can be resolved from `aspire ps` if needed; try with and without
Note the spans carry the source locations as well
Document findings and usage patterns
When done, I'll prompt the next experiment

<!-- Teach it how to write telemetry -->
Read: ZeeqTelemetry.cs, Health.cs, Program.cs to understand how to instrument the application
Distinguish between logging and telemetry and how to use them together
Delineate the use case for logging and telemetry
Understand the custom extension methods used to enrich telemetry spans with local context
Observe how the log instance is initialized per class and how the `Here()` extension method is used to enrich the log context with the call site
Document findings and usage patterns
When done, I'll prompt the next experiment

<!-- Reconciliation and terseness pass -->
Reconcile later findings with initial learnings
Keep the most useful commands for diagnosing issues and tracing code
Omit noise and non-essential, low-utility commands and learnings
Consolidate and tighten up the logging instructions
Focus the skill to be concise, terse, direct, and dense
Like before, add an explicit entry into AGENTS.md to make it more likely to be used.
// AGENTS.md and CLAUDE.md
## Skills

- Use the skill `unit-integration-testing` when writing and running .NET C# tests
- Use the skill `csharprepl` to directly manipulate the running C# application, wrap methods, replace methods, and inspect the runtime state of the application; experiment rapidly without rebuilding the runtime
- Use the skill `aspire-tracing` when working with Aspire to access telemetry and source location as well as best practices for instrumenting the application with OpenTelemetry and logs.
Regroup and recap of the current state
A quick regroup: to this point, we’ve been heavily focused on hand rolling the scaffolding for the application. Part of this is to demonstrate how to design a foundation for enabling fluid agentic engineering in a codebase. Part of this is that no agents will (without a lot of coaxing and hand-holding) produce this type of foundation on its own. This exercise serves both the human operator and also helps agents understand how to build a sound foundation for agentic coding.
The key ingredients that have been the core focus of this series so far:
- Runtime scaffolding to carry types from the database to the front-end of the application (Part 2)
- Aspire to orchestrate the local development runtime while providing agents the tooling to manipulate the runtime state, query for logs and traces, and wire up CSharpRepl (Part 2, Part 3)
- Adding CSharpRepl to allow agents to directly modify the running application without needing to recompile or restart the application; a powerful tool to both diagnose issues and iterate rapidly on the codebase (Part 3)
- A test harness using Testcontainers to allow agents to run tests in a stateless containerized environment (Part 4)
- A logging and telemetry setup that allows agents to trace the flow of the application to the exact source location of the code that provides agents with the context to understand the flow of the application and diagnose issues
This foundational work has mostly been done by hand to help understand the simplicity and significance of each piece and also how to bring this together. Each choice has been made carefully and intentionally to afford coding agents more visibility, more flexibility, and more freedom to work in the underlying codebase while guiding the agent towards producing the type of code that we want. Every decision from IEndpoint and IEndpointHandler split to the usage of Aspire for orchestration to the usage of Testcontainers for ease of testing as well as the thoughtful setup of the logging and instrumentation has been to lay the groundwork for agents.
With this deep understanding and the underlying scaffolding in place, we’re ready to move onto the next phases where we start to build out the rest of the features relying on agents 😎.
Implementing the feature using a coding agent
From this state on, we’ll be relying on prompts to build the rest of the features because the purpose of this series has been to arrive at this point and build a solid set of tools to hand to the agent to use for working with the codebase iteratively. This series has walked through how to wire the orchestration layer (Aspire), give agents the ability to probe and manipulate the runtime (CSharpRepl), give agents a stateless test harness to prove its work (Testcontainers), and give agents the ability to trace the flow of the application and understand the context of the code (logging and telemetry). With this foundation in place, we can now feel more confident relying on prompts to build out the rest of the application.
This video shows walks through exactly how we will build the final prototype of our specification writing tool using the underlying scaffolding that we’ve built so far in the previous steps. I’ve also included a rough series of prompts below so you can try this yourself from the part 5 branch.
Wiring up the API backend
A series of prompts that should get you to a similar endpoint (YMMV based on model, harness, and other factors!):
<!-- Scaffold the two-panel Zeeq Planner UI from a wireframe -->
Get access to a Playwright MCP session. Examine the provided wireframe image showing a two-panel "Zeeq Planner" layout: a left Planning Surface (UEditor) with a Plans select and Save button, and a right Chat Surface. Update src/app/src/pages/index.vue to scaffold this UI using Nuxt UI components.

<!-- Build the Specification storage API on the backend -->
Build a new set of API endpoints for the frontend to store Specifications.
- Reference src/server/Data/Model.cs and src/server/Data/ZeeqContext.cs for the data model.
- Write custom IEndpointHandlers following the pattern in src/server/Endpoints/Health.cs.
- Write integration tests in src/tests/SpecificationTests.cs to verify correct behavior.
- The endpoints must support: loading a list of saved specifications, saving specifications, and receiving diffs (as a string) for changes in the specification, forwarding them to the agent's inbound channel.
- Use a single IEndpoint class per file with all routes mapped on it, rather than one IEndpoint class per route.

<!-- Exercise the diff handler directly via CSharpRepl and trace it -->
Use CSharpRepl to perform a test run against SpecificationDiffHandler and produce a synthetic diff for: "In the Zeeq user session view, we want to add support for wiping out the text content of the session prompts." Use `aspire resource app-backend rebuild` to rebuild and restart the application as needed. Use CSharpRepl to wrap/trace the running handler and confirm behavior with Aspire telemetry.

<!-- Wire the frontend plan editor up to the new backend endpoints -->
A separate agent's frontend work is logged at .agents/logs/2026-08-14-planner-editor.md. Review those frontend changes and connect the plan editor to the backend. Produce a new session and save it. Verify that it is saved using psql.

<!-- Verify multiple plans can be created and correctly reloaded -->
Add another plan. Verify that the full path is able to load/reload different plans into the UI.

<!-- Wire plan saves to produce a diff and forward it to the agent, with results shown in the chat panel -->
On the frontend, when the user saves, produce a diff using jsdiff (see https://raw.githubusercontent.com/kpdecker/jsdiff/refs/heads/master/README.md). Send the diff to SpecificationDiffHandler in src/server/Endpoints/Specification.cs, which forwards it to the agent to produce a research run. The output of the research run should be received and written to the UI in the right panel as an agent response. On the right panel, the agent must also remain directly promptable via the chat input. Review the initial flow diagram to confirm this matches the intended architecture before implementing.

<!-- Retest the diff/research flow with the real plan and real requirements -->
The agent did not produce a research result from the diff. The Copilot session's working directory in src/server/AgentServiceWorker.cs is already correctly set to /Users/cchen/code/zeeq/zeeq-app — leave it as-is; that is where the session-wipe feature actually lives, not zeeq-tmpl. Restart app-backend for a clean session. Re-run the save/diff test against the actual "Zeeq Session Wipe Support" plan (not a placeholder plan), first adding this set of requirements to its content:
<requirements>
- In the session view, add a button that initiates an action to wipe the user prompt from the stored session events
- Add a backing API to perform this action which wipes only the prompt
- The cost telemetry must not be removed or wiped; only the session text
</requirements>
Wiring up the API frontend
<!-- Step 1: configure the left panel with a Nuxt UI Editor, state in a composable -->
Look at src/app/src/pages/index.vue we need to configure the left panel for a UEditor.

<UEditor_Docs>
(Nuxt UI Editor component docs: props, slots, handlers, toolbar/suggestion/mention/emoji/drag-handle sub-components, image upload and AI completion examples, theme)
</UEditor_Docs>

Move the implementation of the state management into a composable for the editor.

<!-- Step 2: layout fixes and enabling drag/drop once the editor was visible -->
Fix the extra padding/margins around the editor area
Enable the block drag/drop in the UEditor

<!-- Step 3: scrollbar regression from the toolbar living inside the scrollable card body -->
get a playwright mcp session.
Fix the scrollbar created by the padding on the top menu

<!-- Step 4: save-flow feature — extract title from markdown or prompt for one via a dialog
     (note: Nuxt UI has no UDialog; use UModal, its dialog/overlay primitive, instead) -->
On click of the "Save" button, use a UDialog to acquire the name of the specification if the first line of the specification in markdown is NOT a title line `#`. Otherwise, parse the name from the title line.

<!-- Step 5: record the work done, for traceability -->
track your completed work in .agents/logs; detail the files referenced, changed, your updates
Test driving the final spec writing application prototype
And here’s a video of my cut of the application in action (note that there is no animation for progress so there is a slight section of inactivity in the middle). Pay attention to the followup and result of editing the file by adding a new requirement.
Closing thoughts
In this series, we’ve hand-rolled the foundational scaffolding for building an AI-enabled, agent-friendly codebase using C# and .NET.
The .NET platform is perhaps a surprising and unexpected choice for teams building these types of applications because of perceptions of the older .NET Framework (tied to Windows) while .NET Core has been cross-platform for going on a decade now and provides modern platform and language features that make building agentic applications more sane.
From the strong support for end-to-end types at build time through runtime to the excellent platform level tooling like Aspire and CSharpRepl, C# and .NET is a strong choice for building agentic applications.
This series has been focused on helping human operators understand how to build this type of application from the ground up to show not only how straightforward it is to build in .NET, but also to understand the facets of a codebase that make it more amenable to agentic development.
Regardless of the platform or programming language a team chooses, these facets of building an agent-friendly foundation carry over and help provide teams and agents the underlying infrastructure to move fast and autonomously in a codebase while facilitating the generation of higher quality code.
Now that you understand the “why” and the “how”, feel free to turn this series into skills for your team to rapidly build up a baseline for every new codebase.
The application we’ve built is simple but real; it’s easy to see how this can be extended to build a more complex agent runtime by leveraging the Copilot SDK and .NET as a host platform. Use your imagination 😎
In a future article, I’ll explore types of service-oriented application architectures that can help agent-first teams move faster and ship more stable code by decoupling dependencies and building “pluggable” applications.
If you are curious to see a real-world setup, check out the Zeeq.ai repo: https://github.com/zeeq-ai/zeeq-app
Still human written (mistakes and all!); see the file history in the repo.